RAST, SEED and Kbase are interrelated bioinformatics tools that
have backend servers providing command line interfaces to all the
functionality provided on their respective web sites. Using these
command line tools, one can directly upload or download data, create
custom analyses, initiate long-running jobs, create their own user
interfaces, run batch operations, and more. Normally, one would have to
download client software to access these servers from a local machine.
With IRIS, we have eliminated that step.The IRIS interface is a
web-based tool that allows one to run command
line scripts accessing these Kbase, RAST and SEED command servers and
some useful UNIX tools, without downloading any software. The interface
keeps track of who you are and stores your results and history on our
KBase IRIS server. The version of the IRIS interface we are describing
is located here. The initial page looks like this:
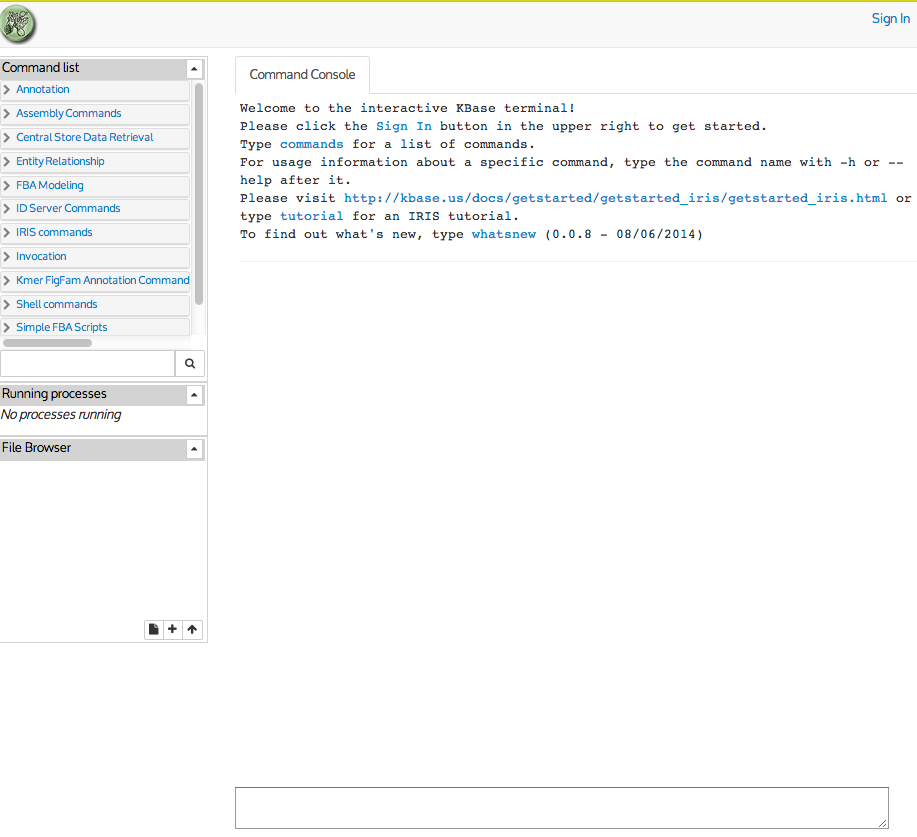
Your first action should be to log in. Click the "Sign In" button in
the upper right and enter your kbase id and password. You should be
rewarded with "Authenticated as ..." message
Notice that commands are entered in the window at the bottom of the
screen in the "COmmand Entry Box"and results are scrolled above it.
To get started, we think of most of the KBase command-line tools as
taking in a file containing a tab-separated table and outputting a
modified table. The most common modification is the addition of one of
more columns. We create "pipelines" of these tools to implement fairly
complex transformations leading to the final table containing the
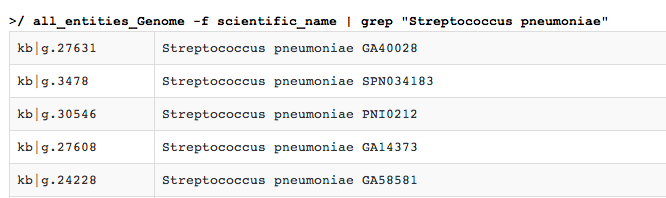
desired output. For example, consider the following little pipeline:
all_entities_Genome -f scientific_name | grep "Streptococcus pneumoniae"
The all_entities_Genome command is thought of as producing a table in
which the first column (by default) is the genome ID, and any extra
columns come from the arguments of the command. In this case, we get a
2-column table:
[genome-ID,genome-name]
This 2-column table is fed into a UNIX command called grep, which keeps
lines that match its argument. In this case, the grep extracts rows
in the table that match the string "Streptococcus pneumoniae". Thus,
we get as a result a 2-column table in which each row contains
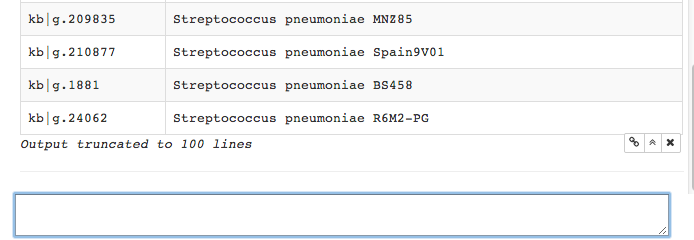
"Streptococcus pneumoniae". During the writing of this tutorial, the output was:
Scrolling down, we see the return list has been truncated to 100 lines.
This is standard in Iris, to avoid overwhelming the display area with
output.
This shows the basic notion of transforming tables, extracting rows
that contain a given string (or, more generally, a pattern), extracting
columns from a table, or sorting the rows in a table is the basic style
we advocate. For example, suppose that you wanted to find all features
of Streptococcus pneumoniae that had been assigned a specific function
(say, triosephosphate isomerase). You might try using
all_entities_Genome -f scientific_name |
grep "Streptococcus pneumoniae" |
genomes_to_fids CDS -c 1 |
fids_to_functions |
grep -i cytidine
This produces output like this:
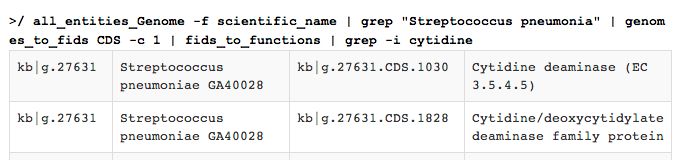
Here, some extra comments need to be made:
- genomes_to_fids is a KBase command that takes a tab-separated table as input, and one of the columns in the table must contain KBase genome IDs. By default, that column is the last column in the table (i.e., the rightmost). If the column of genome IDs is not the last, one uses the "-c N" argument to say that the column is the Nth.
- fids_to_functions is a KBase command that takes a table containing a column of feature ids (i.e., fids), which by default is the last column, and extends the table with one more column, the function assigned to the feature.
- Finally, the "-i" argument to grep makes the match case insensitive. grep is an extremely powerful command with a number of useful options (you can select all rows that do not match, rows that match some specified pattern, etc.)
We now leave it to the reader to complete the exercises in Some Basic Exercises Using the DOE KBase and Getting What You Need from the CS Using Command-Line Scripts.
Additional Features of IRIS
File Storage
IRIS maintains a file system for your use. You can upload your own
data
files (using the file browser upload button in the file browser
interface in the lower left), or create your own via output redirection
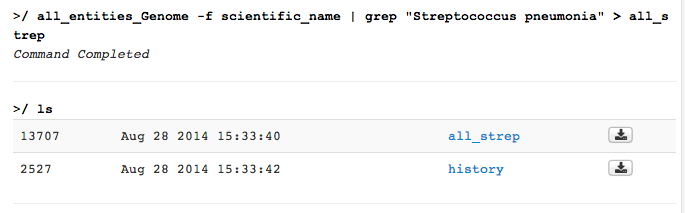
using the > redirection symbol. Let's say you wanted to create a
file of Streptococcus genomes; you would type all_entities_Genome -f scientific_name | grep "Streptococcus pneumonia" > all_strep
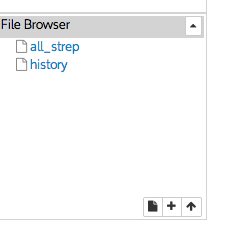
This creates a file with the name all_strep in your IRIS user space. You can see your file system by using the ls command and in the file browser interface.
You can view individual files by clicking on them. The file will open in a new window.
To upload a file you have prepared on your own computer, just click on the "Upload a file" icon in the file browser.
This will bring up a file browser you will use to select a file for upload.