Viewing Antibiotic Resistance Predictions in RAST
Overview
This brief tutorial will step you through the submission of a genome to the RAST website with the purpose of explaining how to view the antimicrobial resistance (AMR) predictions and to view the associated genomic regions on the RAST website. The classifiers have been computed according to the Davis et al., paper1, using the genomes from the November 2016 PATRIC release (Table 1). Note that as of January 2017, AMR classification is only supported for the species and antibiotics listed in the Table 1. If you wish to use our software to make your own classifiers for your personal genomes, please refer to the installation guide on this site. If you have genomes with AMR panel data and you would like us to use them to build new classifiers for RAST, please email us at [email protected].
Table 1. AMR classifiers that are supported by RAST as of January 2017.
|
Species |
Antibiotic |
Classifier
F1 Score |
Classifier
Accuracy |
|
Acinetobacter baumannii |
Carbapenem |
0.94 |
0.94 |
|
Klebsiella pneumoniae |
Gentamicin |
0.88 |
0.87 |
|
Mycobacterium tuberculosis |
Amikacin |
0.90 |
0.91 |
|
Mycobacterium tuberculosis |
Capreomycin |
0.84 |
0.85 |
|
Mycobacterium tuberculosis |
Ethambutol |
0.70 |
0.67 |
|
Mycobacterium tuberculosis |
Isoniazid |
0.86 |
0.87 |
|
Mycobacterium tuberculosis |
Kanamycin |
0.84 |
0.84 |
|
Mycobacterium tuberculosis |
Ofloxacin |
0.77 |
0.79 |
|
Mycobacterium tuberculosis |
Rifampin |
0.84 |
0.83 |
|
Mycobacterium tuberculosis |
Streptomycin |
0.75 |
0.75 |
|
Peptoclostridium difficile |
Azithromycin |
0.97 |
0.97 |
|
Peptoclostridium difficile |
Ceftriaxone |
0.86 |
0.85 |
|
Peptoclostridium difficile |
Clarithromycin |
0.97 |
0.97 |
|
Peptoclostridium difficile |
Clindamycin |
0.74 |
0.74 |
|
Peptoclostridium difficile |
Moxifloxacin |
0.97 |
0.95 |
|
Pseudomonas aeruginosa |
Levofloxacin |
0.85 |
0.85 |
|
Staphylococcus aureus |
Ciprofloxacin |
0.98 |
0.98 |
|
Staphylococcus aureus |
Clindamycin |
0.97 |
0.96 |
|
Staphylococcus aureus |
Erythromycin |
0.96 |
0.96 |
|
Staphylococcus aureus |
Gentamicin |
0.98 |
0.98 |
|
Staphylococcus aureus |
Methicillin |
0.99 |
0.99 |
|
Staphylococcus aureus |
Penicillin |
0.96 |
0.96 |
|
Staphylococcus aureus |
Tetracycline |
0.97 |
0.98 |
|
Staphylococcus aureus |
Trimethoprim-Sulfamethoxazole |
0.96 |
0.94 |
|
Streptococcus pneumoniae |
Beta-lactam |
0.91 |
0.91 |
|
Streptococcus pneumoniae |
Chloramphenicol |
0.94 |
0.94 |
|
Streptococcus pneumoniae |
Erythromycin |
0.96 |
0.96 |
|
Streptococcus pneumoniae |
Tetracycline |
0.96 |
0.96 |
|
Streptococcus pneumoniae |
Trimethoprim-Sulfamethoxazole |
0.88 |
0.88 |
Annotating the Genome
PATRIC maintains a large list of bacterial genomes with AMR metadata. We will start this tutorial by finding a genome at PATRIC that is antibiotic resistant and then annotating it on the RAST website. We keep an up to date list of genomes and their respective AMR metadata on the PATRIC FTP site here: ftp://ftp.patricbrc.org/patric2/current_release/RELEASE_NOTES/PATRIC_genomes_AMR.txt
After perusing this file, I have decided to attempt to classify
Mycobacterium tuberculosis TKK-01-0072. I chose this genome because this
organism is resistant to some antibiotics and susceptible to others (Table 2),
and we have several classifiers for M.
tuberculosis.
Table 2. Experimentally determined AMR phenotypes
for M. tuberculosis TKK-01-0072, PATRIC ID: 1267363.3.
|
Antibiotic |
Susceptible or Resistant |
|
capreomycin |
S |
|
ethambutol |
S |
|
ethionamide |
S |
|
isoniazid |
R |
|
kanamycin |
S |
|
ofloxacin |
S |
|
rifampin |
R |
|
streptomycin |
S |
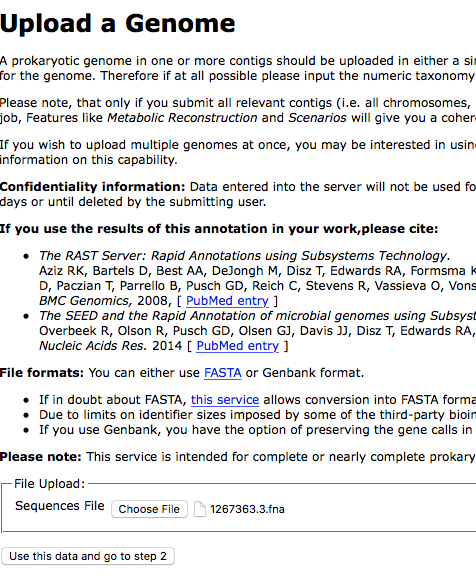
We can download the contigs for this genome to our desktop by going to directory for this genome on the PATRIC FTP site, ftp://ftp.patricbrc.org/patric2/patric3/genomes/1267363.3, and downloading the ".fna " file.
Next we will upload these contigs to the RAST website:
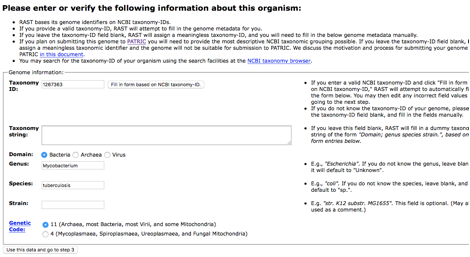
Recognition of a species with a classifier is based on the user-declared genus and species, so when you get to step 2 make sure that this is filled out correctly. Note that if you are trying to classify Clostridium difficile that it is called Peptoclostridium difficile in this system.
When you get to step 3, you must declare RASTtk as the annotation scheme2.
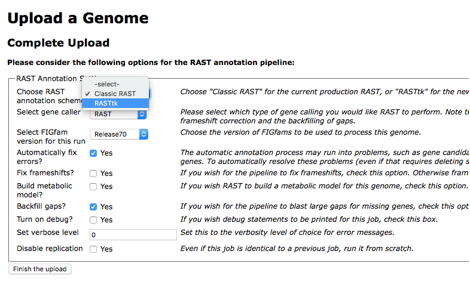
Although it is not necessary, if you select the checkbox for "Customize RASTtk Pipeline", this will display all of the available program options. The program of interest in this case is called "classify_amr". This is turned on by default.
It is a good idea to check the box for "Disable replication". When identical genomes have been submitted to the annotation system, the previous job is saved and propagated to the new genome for efficiency. Disabling this insures that your genome is annotated with the most up-to-date set of classifiers.
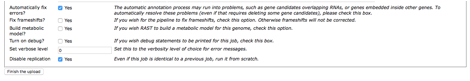
Finally click "Finish the Upload". This will submit the job to the annotation system.
Viewing the AMR Prediction
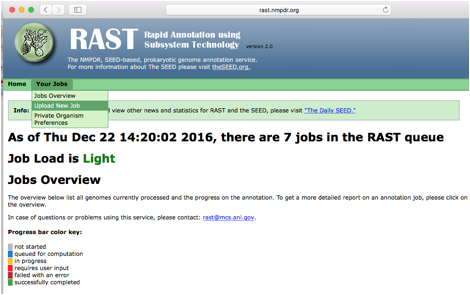
When the annotation job has completed you should go to the jobs overview page and click the "view details" link for the job.
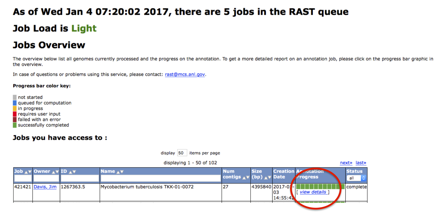
This will take you to the
"Job Details" page.
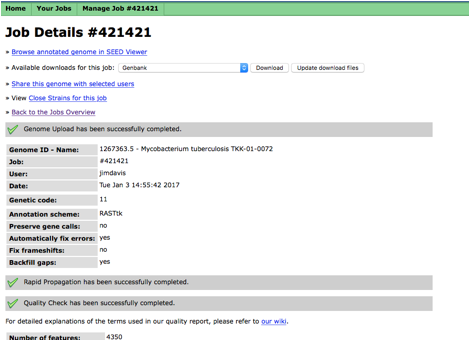
Click on the first link that
says, "Browse annotated genome in SEED Viewer". This will open a new window with the
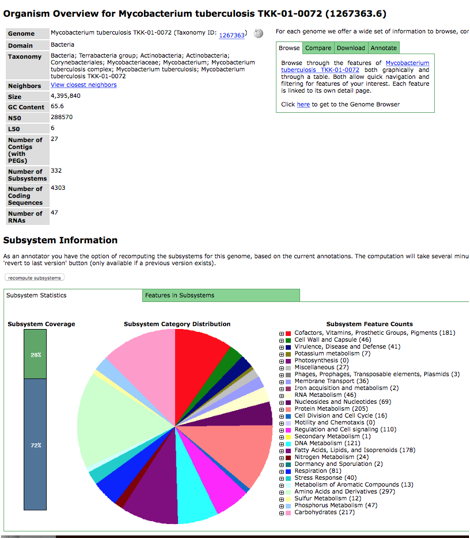
organism overview. If you use RAST
a lot, you will likely be familiar with the subsystem pie chart. If you scroll down this page, below the
pie chart, you will see the AMR predictions.
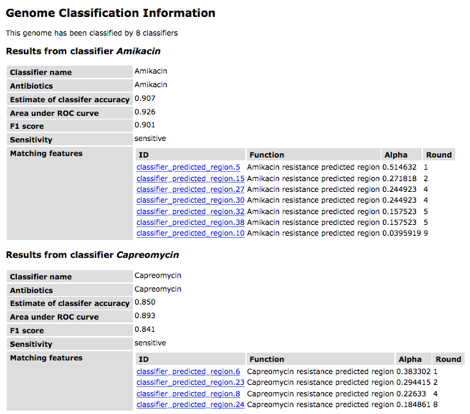
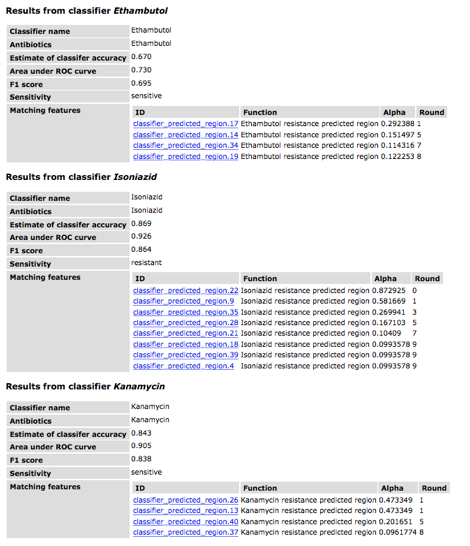
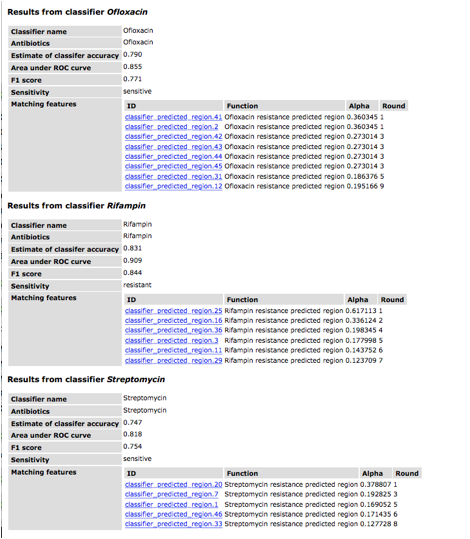
The table for each classifier
shows the name and antibiotic (these are usually the same). The accuracy, area under the ROC curve
and F1 scores are all metrics for evaluating the quality of a classifier. These values are usually similar and are
based on a 0-1 scale. The row
corresponding to "Sensitivity" provides the prediction. Finally the remaining rows display the
genomic regions that are identified by the classifier. The "round" refers to the round
of AdaBoost in which that region was found (this is zero-based). The alpha value is the score in the
voting scheme. Note that the name of the region, e.g.,
"classifier_predicted_region.20", is based upon the order in which
all classifier regions were found in the genome and is not related to voting or
importance.
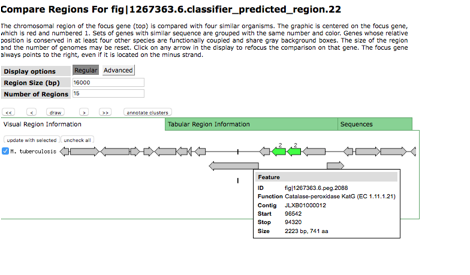
If you click on a region in a
classifier table it will take you to a landing page displaying that region.
You should keep in mind that
the AdaBoost method often captures strain variation from the sets of genomes
that were chosen to build the classifiers, so you usually find
resistance-related regions in susceptible genomes. However in this example, these do not
add up to make an incorrect prediction of "resistant". Secondly, you should pay close attention
to the accuracy in order to understand the quality each classifier (some classifiers
are better than others) as well as the alpha-value for a region which gives you
a measure of that region's importance in the voting scheme. For a detailed description of how the
method works, please refer to the paper1. Finally,
you should also note that the classifiers capture the sequence variation that
we have seen previously. They may
not match alleles that are more rare.
In these cases, you will likely get a prediction of
"sensitive" when your genome is not actaully sensitive to the
antibiotic. The classifiers are a
work-in-progress and we are on a regular update cycle where we are adding new
genomes with AMR metadata to PATRIC, building new classifiers, deploying them
in the system and exploring new methods for building classifiers. As the collection grows the accuracy,
alleles and organisms covered will continue to improve.
References
1 Davis,
J. J. et al. Antimicrobial resistance
prediction in PATRIC and RAST. Scientific
reports 6 (2016).
2 Brettin,
T. et al. RASTtk: a modular and
extensible implementation of the RAST algorithm for building custom annotation
pipelines and annotating batches of genomes. Scientific reports 5
(2015).